
|
Home >
Settings >
Archives >
October 2021 >
Geospatial Analysis using Open Source Tools
Geospatial Analysis using Open Source Tools
Curious to learn about how you can try out geospatial data analysis? Speakers from the Singapore Management University (SMU) and the Singapore Land Authority (SLA) discussed open source tools, such as QGIS, Python and R, which can be used for geospatial data analysis during the Regional Geospatial Youth Forum’s GeoEducation II session at the Singapore Geospatial Festival 2021.
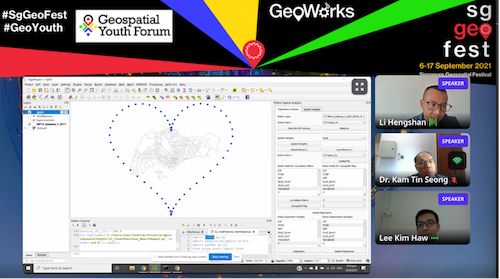
To kick us off, Lim Kim Haw from SLA discussed the use of QGIS, a well-known geospatial software with a Graphical User Interface (GUI). It has more than 200 built-in processing tools and thousands more plugins available. While the number of libraries can be intimidating, Kim Haw highlighted that a good starting point is to understand what your aim is and focus on just one objective or tool to explore. He also shared with us some of his favourite tools to use within QGIS, including QNEAT 3 for network analysis and Data Plotly, an interactive plotting tool that can be used for data dashboarding.
Li Hengshan, also from SLA, followed up by showing how to undertake geospatial data analysis using a Command-Line Interface (CLI). He showed how Python can be used with QGIS’ PyQGIS API and also how we can harness the power of other Python libraries like Numpy, GeoPandas and PySAL. He took us through a number of interesting examples, going from Geospatial Visualisation, where we can make animations to help us visualise spatio-temporal data, to Geospatial Optimisation, where he showed an example of finding optimal warehouse locations for supply chain management.
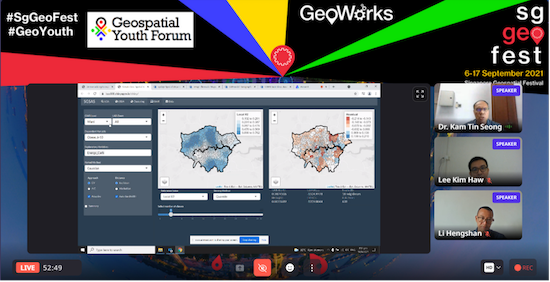
Professor Kam shared the link to his interactive dashboard which was built with R-Shiny.
Finally, Professor Kam Tin Seong from SMU shared with us on the use of R to undertake geospatial data analysis and R Shiny that can be used to easily create geospatial dashboards in an interactive web app that can be shared simply through a link. He also shared with us a dashboard he had previously created. Using just one type of technology, R, we are able to both undertake the analysis aspects as well as the sharing and visualisation aspects.
This webinar has shown that there are many free and open source tools out there and has inspired us to try them out.
View recording here.