Financial Review
5-Year Financial Summary
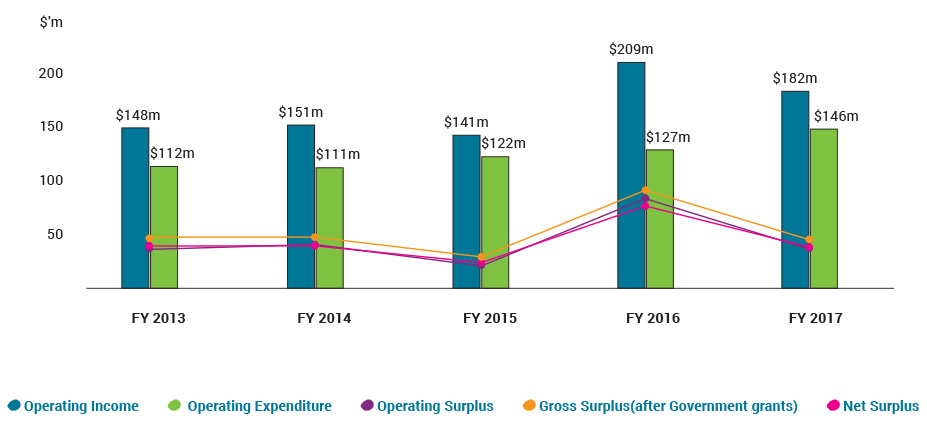
| 5-Year Financial Summary ($'m) | FY2013 | FY2014 | FY2015 | FY2016 | FY2017 |
 Operating Surplus Operating Surplus |
35.9 | 39.9 | 19.7 | 81.9 | 35.9 |
 Gross Surplus (after Government grants) Gross Surplus (after Government grants) |
45.9 | 46.4 | 28.1 | 90.7 | 45.3 |
 Net Surplus Net Surplus |
38.2 | 38.5 | 23.3 | 75.2 | 37.6 |
Financial Highlights
For FY2017, the Authority recorded a net surplus of $37.6 million before other comprehensive income, a decrease of 50% over the $75.2 million in FY2016.
Operating Income
The Authority’s operating income comprised agency fees, regulatory fees, processing fees and other fees and charges. FY2017 operating income of $182.2 million was lower by 13% (or $27.1 million).
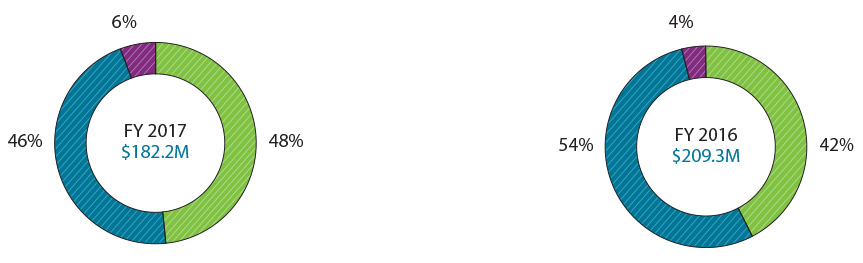
| Operating Income | FY2017 | FY2016 | Increase/ Decrease | |
| $'m | $'m | $'m | % | |
 Agency Fees Agency Fees |
88.3 | 88.7 | (0.4) | - |
 Regulatory Fees & Charges Regulatory Fees & Charges |
83.6 | 112.6 | (29.0) | -26% |
| Other Fees & Charges |
10.3 | 8.0 | 2.3 | 29% |
| Total | 182.2 | 209.3 | (27.1) | -13% |
Operating Expenditure
Operating expenditure of the Authority increased by 15% (or $18.9 million) to $146.3 million for FY2017.
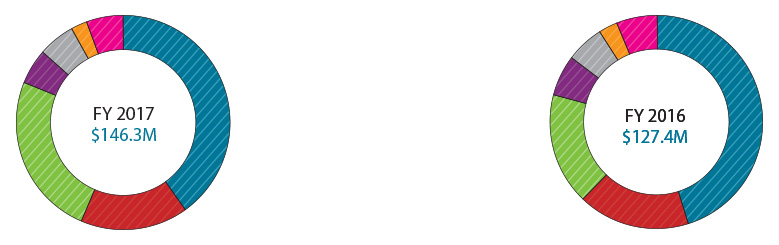
| Operating Expenditure | FY2017 | FY2016 | Increase/ Decrease | |
| $'m | $'m | $'m | % | |
| Expenditure on Manpower |
58.8 | 57.8 | 1.0 | 2% |
 Maintenance of IT Systems & Services Maintenance of IT Systems & Services |
23.7 | 21.5 | 2.2 | 10% |
| Expenditure relating to Agency Functions |
36.1 | 21.4 | 14.7 | 69% |
| Rental Expenses |
7.9 | 7.9 | - | - |
 Depreciation & Amortisation of Assets Depreciation & Amortisation of Assets |
8.2 | 7.3 | 0.9 | 12% |
| Project & Professional Fees |
3.5 | 3.7 | (0.2) | -5% |
| Others |
8.1 | 7.8 | 0.3 | 4% |
| Total | 146.3 | 127.4 | 18.9 | 15% |
Financial Position
As at 31 March 2018, the Authority’s financial position strengthened, with total equity at $346.4 million, an increase of $27.2 million from a year ago. This was mainly attributable to the net surplus of $37.6 million for FY2017, offset by the dividend paid to Government of $9.0 million in FY2017.
Total assets of the Authority stood at $441.9 million, whilst liabilities totalled $95.5 million.
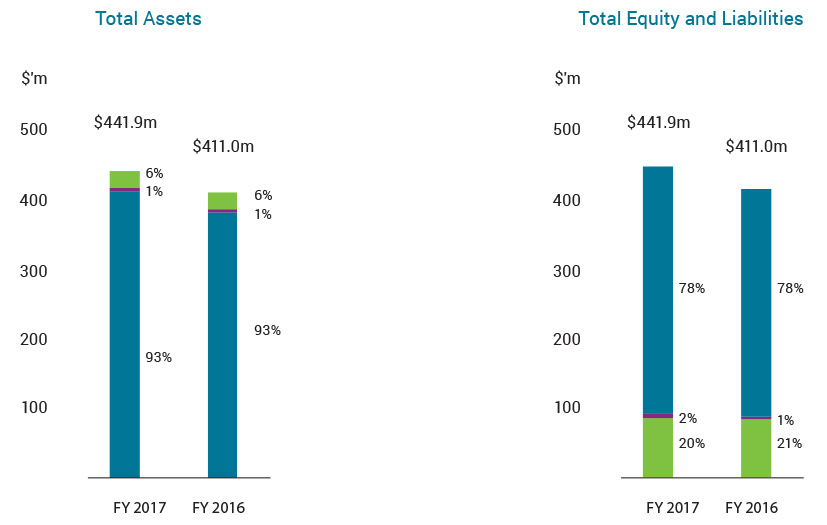
| Assets | FY2017 | FY2016 | Increase/ Decrease | |
| $'m | $'m | $'m | % | |
| Property, Plant & Equipment and Intangible Assets |
24.8 | 23.0 | 1.8 | 8% |
| Other Non-Current Assets |
3.4 | 6.1 | (2.7) | -44% |
| Current Assets |
413.7 | 381.9 | 31.8 | 8% |
| Total | 441.9 | 411.0 | 30.9 | 8% |
| Equity & Liabilities | FY2017 | FY2016 | Increase/ Decrease | |
| $'m | $'m | $'m | % | |
| Equity |
346.4 | 319.2 | 27.2 | 9% |
| Non-Current Liabilities |
6.1 | 4.4 | 1.7 | 39% |
| Current Liabilities |
89.4 | 87.4 | 2.0 | 2% |
| Total | 441.9 | 411.0 | 30.9 | 8% |